

Use Fibonacci Retracement for Entry Points — Hands-On
Use Fibonacci Retracement for Entry Points — Hands-On. Get practical lessons and hands-on examples at AI Computer Classes in Indore to master trading & stock market skills quickly. Ideal for beginners and working professionals seeking fast skill gains. This article from AI Computer Classes Indore breaks down “Use Fibonacci Retracement for Entry Points — Hands-On” into actionable steps. Includes references to tools like ChatGPT, Power BI, Excel, Figma, or Python where appropriate.
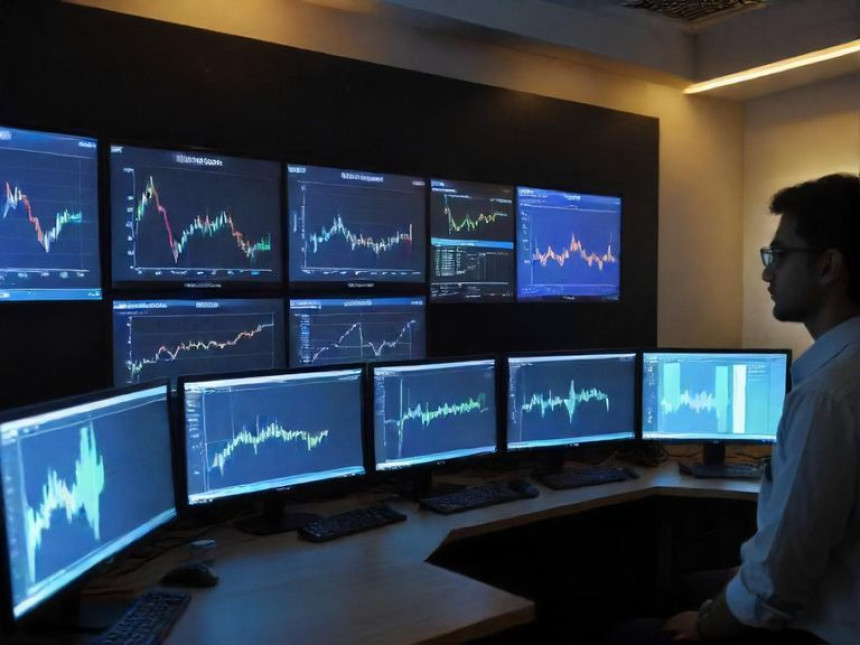
📈 Use Fibonacci Retracement for Entry Points — Hands-OnTrading successfully requires more than luck — it’s about recognizing patterns, making informed decisions, and managing risk wisely. One of the most powerful tools professional traders use to identify potential entry and exit levels is the Fibonacci Retracement.
At AI Computer Classes – Indore, we teach students and working professionals how to apply Fibonacci levels practically, using tools like TradingView, Excel, and Power BI for analysis. In this blog, we’ll break down step-by-step how you can use Fibonacci retracement levels to time your market entries smartly.
Fibonacci Retracement is a technical analysis tool that helps traders find support and resistance levels in a price chart. It’s based on the Fibonacci sequence, a mathematical pattern found in nature, architecture, and even stock price movements.
The key Fibonacci levels traders watch are:
- 23.6%
- 38.2%
- 50%
- 61.8%
- 78.6%
These percentages represent how much a price might pull back before continuing in its original trend.
Learn TradingView strategies, Fibonacci indicators, and technical chart reading with real market data.
🚀 Hands-on classes for beginners and advanced traders!
👉 Visit AI Computer Classes
🧩 Step 1: Identify the TrendBefore drawing Fibonacci levels, identify whether the market is trending up or down.
- If the trend is upward, draw from the lowest swing to the highest swing.
- If the trend is downward, draw from the highest swing to the lowest swing.
This sets the retracement framework — showing where prices might pull back before resuming their trend.
Use tools like TradingView or MetaTrader:
- Select the Fibonacci retracement tool.
- Click from the start of the move (swing low/high) to the end of the move.
- The tool automatically displays retracement levels.
For example:
If a stock rises from ₹100 to ₹160, the Fibonacci levels will be at:
- 23.6% → ₹145
- 38.2% → ₹140
- 50% → ₹130
- 61.8% → ₹125
These become potential buy zones during retracements.
Fibonacci levels work best when confirmed with other signals.
Use:
- RSI (Relative Strength Index): to check if the stock is oversold.
- MACD: to identify momentum reversal.
- Volume spikes: to confirm buyer interest at Fibonacci levels.
Combining these gives a more accurate picture of where to enter the trade.
You can also use Excel or Power BI to visualize Fibonacci levels:
- Enter your swing high and low.
- Apply Fibonacci percentage formulas to calculate retracement values.
- Create a chart overlay to see where price corrections align with Fibonacci zones.
This approach helps data analysts and traders alike visualize support/resistance zones programmatically.
Let’s say a stock moves up to ₹200 and then starts falling.
Plot Fibonacci from ₹150 (low) to ₹200 (high).
Your potential entry levels:
- 38.2% retracement (₹181) — moderate pullback, early entry.
- 50% retracement (₹175) — balanced entry point.
- 61.8% retracement (₹169) — strong pullback, safer entry.
Set stop loss just below the 61.8% level and target near the previous high or 127% extension.
💻 Learn how to apply Fibonacci, moving averages, RSI, and MACD in real-time.
📈 Includes practical sessions using TradingView and Excel.
👉 Join the Trading & Stock Market Course
📊 Step 5: Understand the Psychology Behind FibonacciFibonacci levels are not magic — they reflect collective human psychology.
Traders worldwide use them, creating self-fulfilling reactions at those levels.
When price approaches a Fibonacci retracement level, traders expect a bounce or reversal, which often actually happens due to large buy/sell orders at those zones.
That’s why Fibonacci remains one of the most reliable technical tools in both forex and stock markets.
Fibonacci levels get stronger when they align with other support/resistance areas.
Example:If a 61.8% retracement coincides with:
- A long-term trendline, or
- A moving average (like 50-day EMA),
That level becomes a high-probability trade entry.
Always check confluence before entering.
Even with perfect Fibonacci entries, risk management is key.
Follow the 2% rule — never risk more than 2% of your trading capital on a single trade.
Bonus Tips:- Use stop-loss orders below the next Fibonacci level.
- Avoid trading during news volatility.
- Use trailing stops to protect profits as price moves in your favor.
Let’s analyze an example on TradingView:
- Nifty index rises from 19,000 → 20,000.
- It retraces to the 61.8% level (19,380).
- Volume increases, RSI shows 40 (oversold zone).
- Entry near 19,400 → Exit near 20,100 (Fibonacci extension 127%).
✅ Profit: Safe entry with confirmation from Fibonacci, RSI, and volume.
📍 Learn to read charts, backtest strategies, and analyze data with Fibonacci tools and Excel dashboards.
🧠 Expert-led sessions for beginners and professionals.
👉 Visit AI Computer Classes
🎯 ConclusionFibonacci retracement is not just a mathematical tool — it’s a psychological and strategic framework that helps traders identify entry, exit, and stop-loss levels effectively.
By combining it with indicators, confluence zones, and data visualization tools like Excel and Power BI, traders can make smarter, more consistent trading decisions.
At AI Computer Classes – Indore, our Trading & Stock Market course ensures you don’t just learn theory — you practice real-world strategies hands-on.
So next time you open a chart, let Fibonacci guide your next confident entry. 🔢💹
📞 Contact AI Computer Classes – Indore
✉ Email: hello@aicomputerclasses.com
📱 Phone: +91 91113 33255
📍 Address: 208, Captain CS Naidu Building, near Greater Kailash Road, opposite School of Excellence For Eye, Opposite Grotto Arcade, Old Palasia, Indore, Madhya Pradesh 452018
🌐 Website: www.aicomputerclasses.com


Complete Guide: Reading Candlestick Patterns for Beginners — Advanced...